AI x Coral Reef Monitoring: An Introduction
An intro to how marine data is collected and the innovations happening in this space
As I embark on a new role with an India marine conservation NGO, Coastal Impact, to help facilitate coral conservation in India, I am getting to explore more and more of the coral conservation x AI side i.e. how do we use AI tech to solve problems in and around the domain of coral conservation.

This is an extremely interesting area where researchers, conservationists, hobbyists, etc. are working together to try and solve a P0/P1 problem. The intersection of different areas of AI with the entire suite of activities involved in coral conservation open up plenty of opportunities. One of the problems that I am personally interacting with is of figuring out how to use computer vision to speed up the process of surveying and monitoring of sites underwater.
When monitoring an underwater site, there are usually multiple variables that conservationists are interested in measuring. Variables like the depth profile of the site, reef profile, visibility, current strength, water quality, species composition, coral diversity, biomass, coral bleaching, etc. help us in understanding what a site is, how is it changing with time, how we can develop management plans for it, and what sort of activities should be curtailed/allowed amongst other action points. These indicator variables are typically noted or captured during specific survey dives which include trained divers who use slates/photography/videography to capture marine information.

Depending on the type of study, whether it’s long term or short term, if you are surveying a large or a small area, the turbidity of the water, and sooooo many other parameters, experts will usually pick out a method of surveying the selected site. Let’s take a quick look at some of the important methods!
Survey Methods
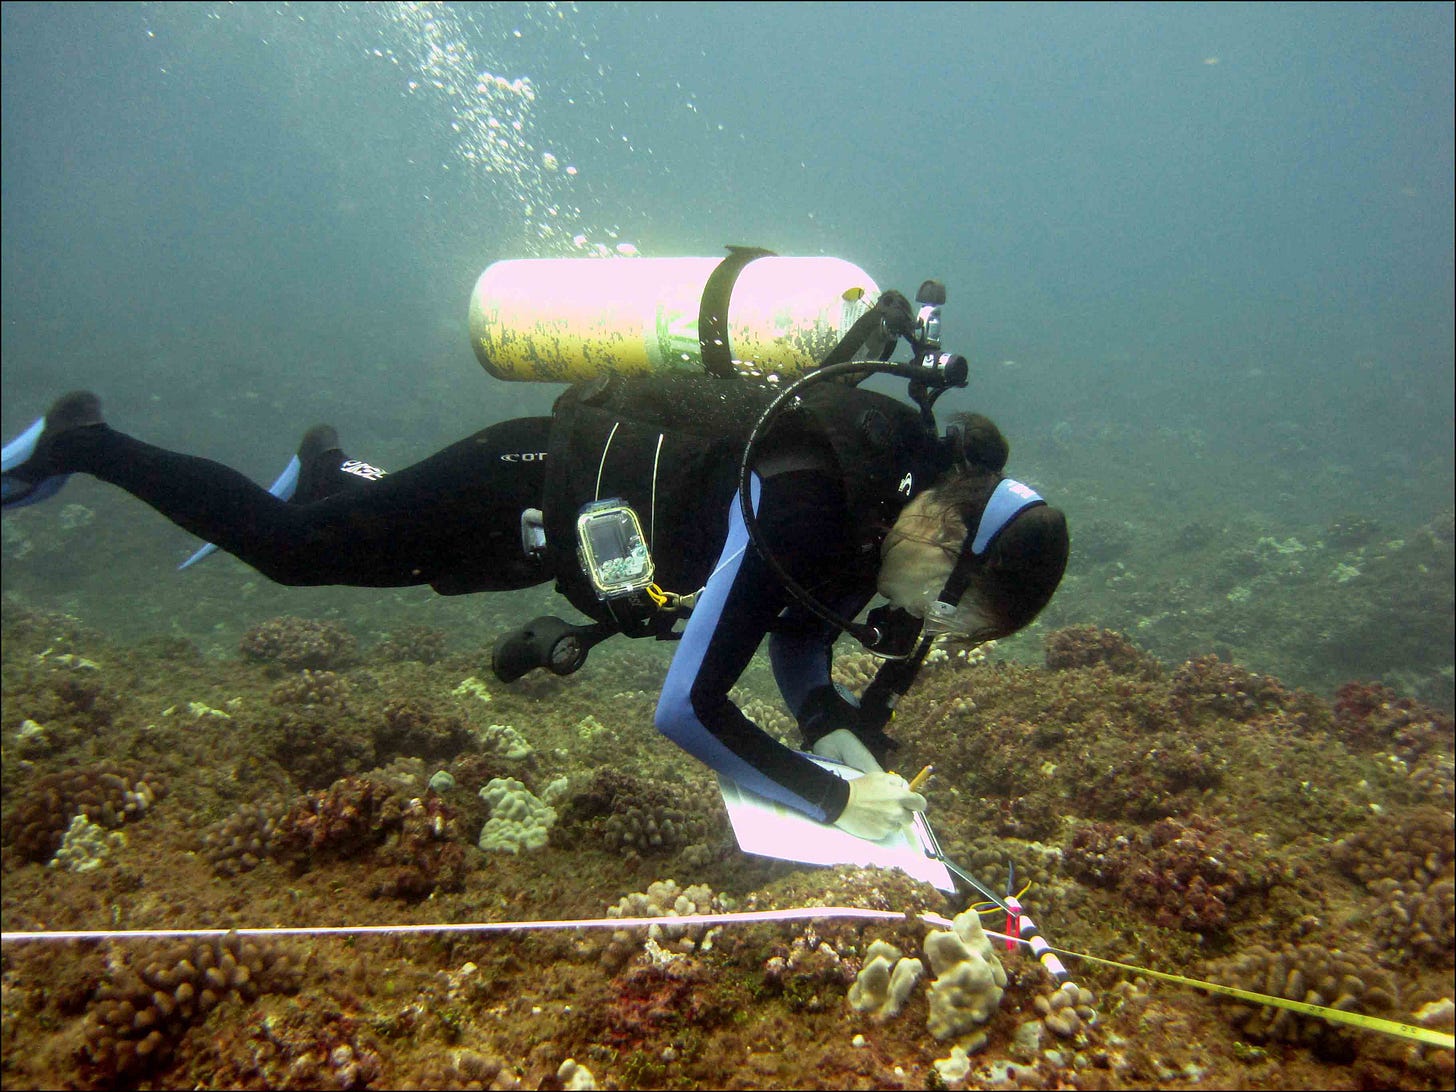
The Belt Transect method, also called line transect, is extremely famous for counting reef fish, doing a benthic analysis, coral reef profiling, etc. A 25m or 50m transect (a sort of measuring tape) is laid out along which the surveying diver must swim and make a note of the fishes they observe within a limited field of view along that transect.


This is something I tried very recently too and it was extremely fun but tough. Your buoyancy and fish ID skills become the most important as your buoyancy control has to be super automated while IDing schools of fish.
Along with the fish ID, we also tried to mark the size of the fish (to estimate biomass) and make a note of any unusual things we saw at the back of the slate. I have attached a picture below, but given my skills and handwriting, at this point, I am probably not the best person to be doing this 😅

The Stationary Point Count method (SPC) is used to monitor reef fish too, especially when you have less resources. A single diver can do this on their own by defining a cylindrical area in the ocean where they stay and count the fish for some predefined time.
We had an intern practicing this too and it seemed fun. Really good way to practice just your fish ID skills without caring about your air consumption or buoyancy.

A Manta Tow survey includes a snorkel diver being towed behind a boat and making observations about the water, types of species, counts, etc. on a board/device while being dragged by the boat. It’s a very good technique if you aren’t making super detailed observations and have to cover a large area.

In Roving Diver Surveys, divers/snorkelers swim freely throughout a selected site and try to record every observed fish species that can be positively identified or individuals of a set of target species. Data might be recorded on a slate or photographs are taken.
In the Bar drop method, the diver swims in a straight line along the reef contour and places a bar on the substrate every 3ish kicks. The diver then measures the organisms/corals under the bar. They usually do this on set transects.
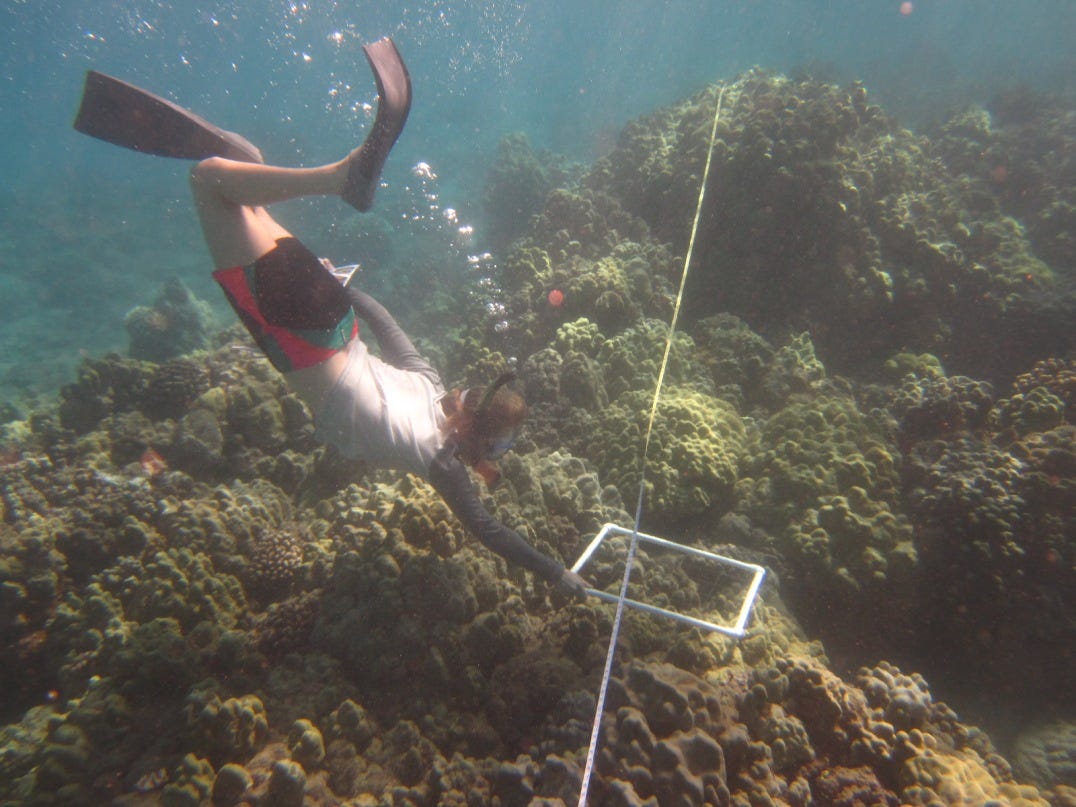
Quadrats are very commonly used too and involve monitoring indicator variables by using squares of a particular size (commonly with 1m sides) and placing them along transect lines to assess what is lying in those quadrats. Very common technique to sample portions of the reef lying along transect lines in detail.

The fun thing is that a lot of the technological advancements are now coming from mixing these traditional techniques with the latest technology to make certain aspects of these processes easier. For this post, let’s briefly explore one of the innovations happening in this space!
Image Processing
The broad category of image processing involves all the technology that allows us to process images after they have been collected more effectively and efficiently. Tasks which were earlier performed by scientists in the lab post the data collection are now being automated to save them days of work. In fact, a couple of days back I was talking to a PHD student from IISc, India who is using drones + AI on the drone footage to understand how dolphins along the coast of India interact with fishers. For him, counting the number of dolphins in each frame of the video has become extremely easy post applying a number of machine learning techniques.
There are two broad categories that I have divided work being done in this space into.
Non-Satellite Image Processing
To automate the counting and identification of indicator variables, computer vision techniques are being heavily used. Object detection, segmentation, and classification models like Yolo and SAM make it easy to detect and segment corals, track plastic in the ocean, classify hard coral cover, identify and count target fish, etc. This reduces the number of hours involved in post processing massively and frees up human labour to concentrate on higher level tasks.
We are working on similar applications at Coastal Impact, where we are trying to create a coral segmentation software for our coral tables. A very interesting challenge for us is the excessive turbidity that plagues Goa waters but experiments are being tried around preprocessing to remove that. The way we are approaching this is to initially create a human-in-the-loop interface so as to reduce the number of errors in the final data and then gradually move onto a fully AI-based system.

Satellite Image Processing
Multiple organisations are harnessing the power of processing of satellite images to help monitor the oceans. These techniques completely remove the need for manual surveys for particular indicators in particular conditions. Monitoring of large areas becomes easier with this set of techniques. However, they work especially well for shallow tropical water reefs and don’t work well for deeper or highly turbid waters and additionally, the monitoring really depends also on how frequently a site is being photographed by a satellite.
Reef support’s Plastic Tracker use GAN-enhanced satellite imagery to develop models that allow them to track plastic flowing in oceans, rivers, and lakes. Their Algae Tracker does the same for detecting algae blooms. Coral Reef Watch has been using satellite images to get extract information the health of the oceans and coral reefs in near real-time. Especially to monitor coral bleaching events and how thermal stressors affect reefs.

This calls for an abrupt end hehe.
Albeit this was an extremely brief look at some of the work being done in this space, I am working on a part II to continue talking about some of the innovations that are making surveys and data collection/processing easier and much much much more efficient. Especially with a bit more focus on the AI models being used.
Till then…keep diving and keep hating on the surface interval 🐬

